

HTTP History
HTTP History lists captured requests and responses for the current project. Capture settings determine which traffic is stored; HTTPS tunneled through TLS bypass cannot be inspected as decrypted HTTP.
The Traffic Table
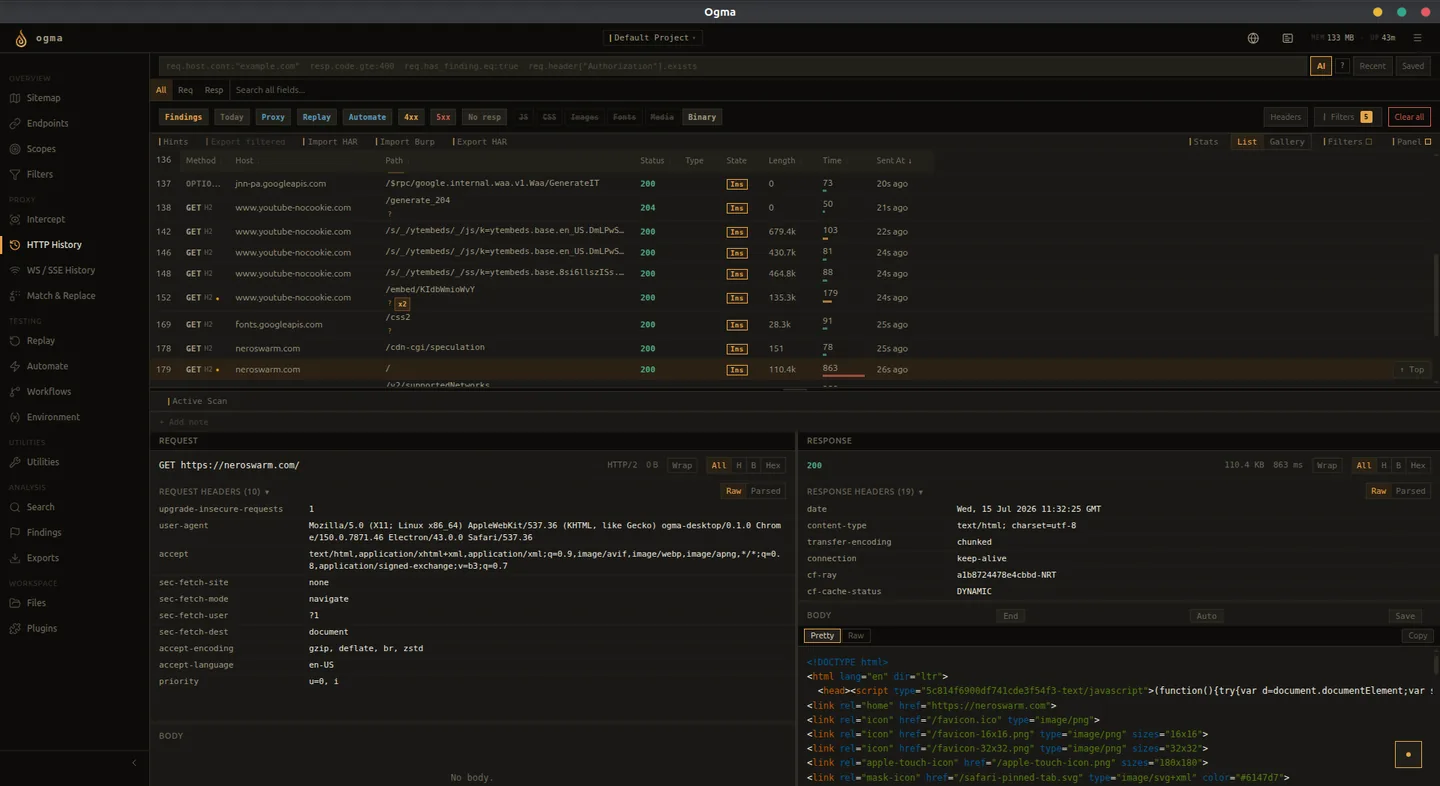
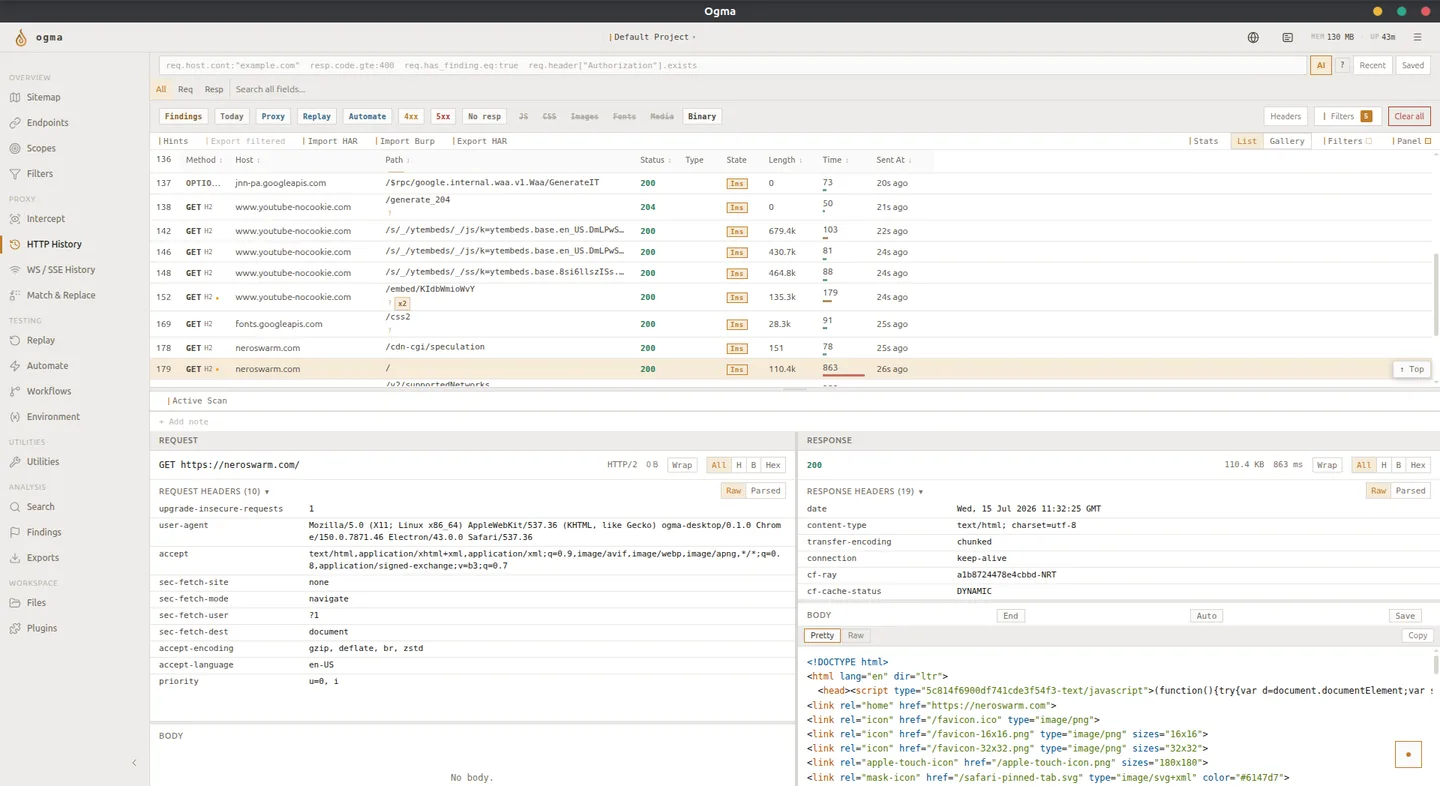
Each row represents one request-response pair. The columns are:
| Column | Description |
|---|---|
| Method | HTTP method (GET, POST, PUT, etc.) |
| Host | Target hostname |
| Path | Request path and query string |
| Status | HTTP response status code |
| Size | Response body size in bytes |
| Time | Round-trip time in milliseconds |
| Source | Where the request originated (proxy, replay, automate, active_scan, discovery) |
| Tags | User-assigned labels |
| Color | Triage color applied to the row |
| State | Source and modification indicators; modification is distinct from inspection |
Click any row to open the request and response in the detail panel below the table.
Inspecting a Request
The detail panel contains Request and Response panes. Headers and bodies have independent scroll areas. The request URL wraps so you can select and copy only the portion you need; use its copy action for the entire URL. Body views include formatted text, raw data, and type-specific views where supported.
Use the search bar inside the body viewer to locate specific strings in large response bodies.
Filtering Traffic
HTTPQL
Type an HTTPQL expression into the filter bar to narrow the table. HTTPQL supports filtering by host, path, method, status code, response body content, header values, tags, and source.
You can express filters such as:
- All POST requests to a specific host
- Responses with a 4xx status code
- Requests tagged with a specific label
- Traffic from one particular tool
See the HTTPQL reference for the full syntax.
Table Filters and Time Ranges
Use Table Filters to control which asset types and rows are visible. Duplicate counts are hidden by default; enable Duplicates when you need them. Column controls let you choose visible fields and resize them independently of sorting.
The Today preset uses the query date boundary at midnight UTC. Timestamp display can use your local timezone independently, so entries near midnight may belong to a different displayed calendar date.
Modified and Inspected Traffic
A modified indicator means Intercept or Match & Replace changed the traffic. Filter these entries with req.modified.eq:true. Inspection does not imply modification: HTTPS decryption and reviewing an entry are not themselves edits. Use the Inspected control to narrow inspected traffic without typing a bare state label as a query.
Filtering by Source
The Source column identifies where each request came from. Filter by source to isolate traffic from a specific tool or workflow:
| Source value | Origin |
|---|---|
| proxy | Requests from a browser or external client through the proxy |
| replay | Requests sent from the Replay tool |
| automate | Requests generated by an Automate campaign |
| active_scan | Requests sent by the Active Scanner |
| discovery | Requests sent by Content Discovery |
| workflow | Requests sent by workflow request nodes |
Tagging and Color-Coding
Tags and colors let you track the state of traffic during a review.
- Right-click a row and select Add tag to apply one or more labels.
- Right-click and select Set color to assign a triage color.
- Filter by tag in HTTPQL to retrieve all traffic with that label.
Use colors consistently - for example, red for confirmed issues, yellow for items to revisit, green for reviewed clean requests.
Actions on Selected Requests
Select one or more rows to access context actions:
| Action | What it does |
|---|---|
| Send to Replay | Opens the request in Replay for modification and resending |
| Replay collection | Sends requests directly to an existing Replay collection |
| Send to Automate | Adds the request to an Automate campaign |
| Send to Workflow | Runs an enabled active workflow on the selected requests, one by one |
| Create Finding | Creates a finding with this request attached as evidence |
| Copy request | Copies a request in a supported command/script format for reproduction |
For Send to Workflow, create and enable an active workflow first. Only the selected entries are supplied; this is different from scanning the whole captured history from the Workflows page.
Deleting Traffic
The selection delete action removes only selected entries. Delete All removes all HTTP History entries in the current project, including entries hidden by filters and entries not loaded in the table. Read the confirmation before proceeding; deletion cannot be undone. Export or back up evidence you still need first.
View Modes
Toggle between List view and Gallery view using the view selector in the top-right corner.
- List shows the full table with all columns. Use this for most work.
- Gallery shows response cards for a visual overview. Select a card to inspect its request and response.
Tips
- Hide static asset types when reviewing application logic.
- Activate a Scope preset to keep target traffic prominent and filter out noise.
- Save common HTTPQL expressions for repeated reviews.